Graph-Based Fraud Detection
Connecting Data Differently to Uncover Knowledge
August 17, 2017 · Alex Ulbrich

Table of Contents
Fighting insurance fraud is an expensive process. Let’s have a look at how new technologies can help save time and increase detection rates.
Framing the Problem
At the time, we were sitting on a huge amount of normalized data. We had just created what we called our “One Client View” (OCV). The OCV is an enriched consolidated view of:
- all contracts and claims,
- for all individual customers, all households, and all actors,
- across all business units and brokers.
This was a major achievement that allowed us to:
- build cross- and up-selling models,
- compute the lifetime value of customers across products,
- get holistic statistics about the business.
We had other strategic projects ongoing at the same time that did not specifically require the OCV (but relied on it, given how well the data had been processed).
Could we leverage this OCV in other ways that benefited the business?
We had a lot of interactions with business users at the time, and one thing that came up during coffee machine chit-chat was fraud. Curious, we had a look at the cost of fraud in Belgium: from 250M to 500M EUR (or 5–10% of total claims for the non-life market).
This was quite a shock, and as the largest insurer in Belgium, it warranted further examination from the data geeks that we were.
Discovery
In the discovery phase, we spend time understanding the current situation, identify and frame the problem in more details, and finally identify opportunities for improvements.
Scope and Team
Given our larger experience with car claims, we decided that it was probably the safest choice to start with (instead of home insurance). We reached out to the claims motor department and explained that we wanted to spend some time with claim handlers. We wanted to better understand the claim handling processes, and in particular the fraud detection bit.
We teamed up with data engineering, claim experts, and fraud inspectors. We also had the support of IT infrastructure and procurement from the moment we started the prototype. Finally, we reached out to the holding (Ageas) to collect more information about fraud prevention in other operating companies. We got in touch with super interesting people and agencies (which ended up with a trip to the UK).
Mapping the Process and Data
Claim management allowed us to shadow some handlers for a couple of days, and ask questions. I won’t describe here the full claim handling process, but here’s how suspected fraudulent cases are handled.
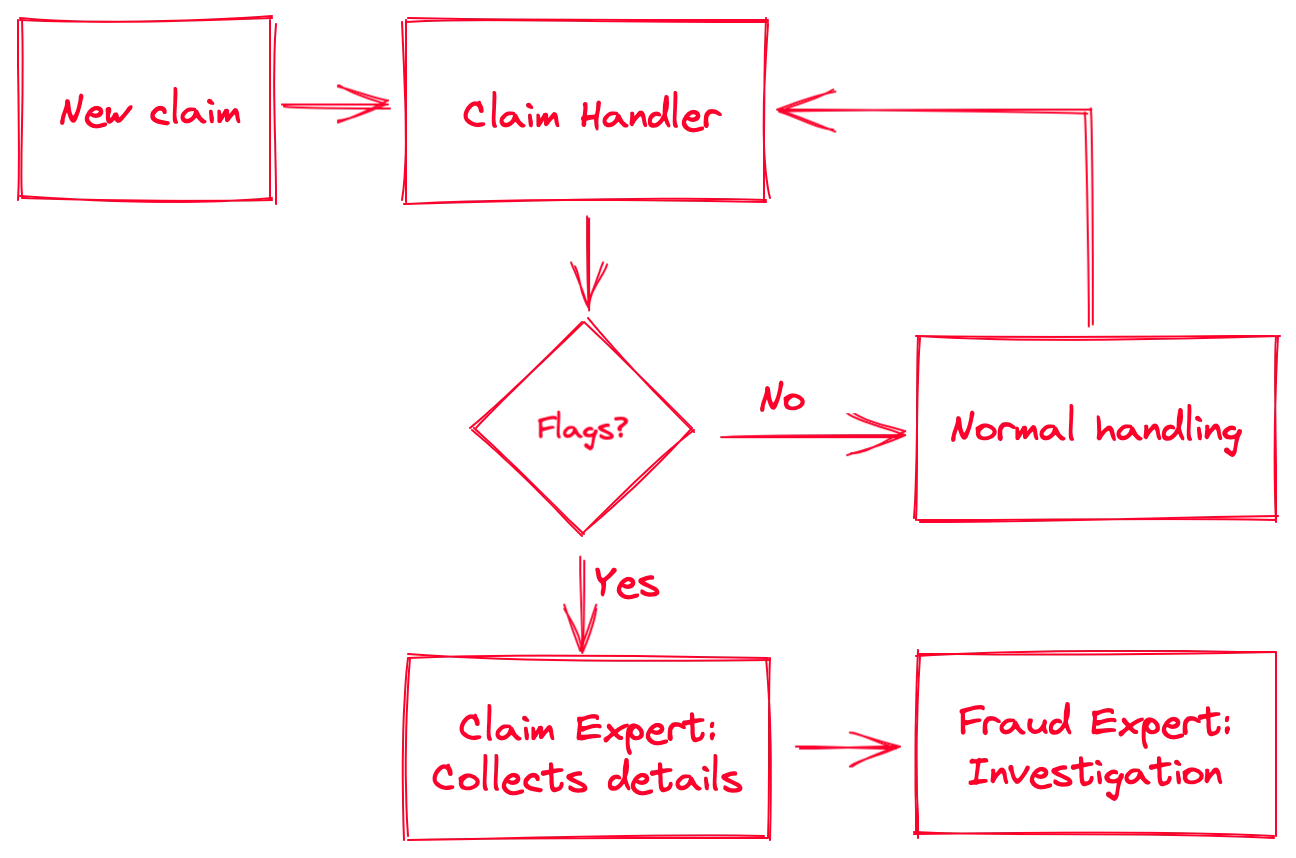
As you can see, there’s a decision step that involves “flags.” A (red) flag is an event that is triggered either by the system or by the claim handler if there’s a suspicious claim. Here are some examples of red flags:
- Automated flags:
- Claim happens in the three months following the contract start date
- Claim involves a secondary or unreported driver younger than 25
- Third claim for that contract or person in the same year
- Manual flags:
- Location or time of claim is unusual (for example a car crash at 3 AM in a rural area, no witnesses, and no casualties)
- Recurring name or situation (the name of the driver or the location of the crash rings a bell)
Note that in larger (i.e., more expensive) nonlife claims, they send an inspector on the site to evaluate the damages. Sometimes they will notice something suspicious which will be reported in the file and might trigger a red flag.
Once a claim is flagged, the file goes to the second level: the claims motor department’s experts. Their job is to build a report on the suspicious claim by collecting all available information from the systems. This includes searching for names, details, contracts, previous claims, third parties, witnesses, images, … basically everything that can be connected to that particular claim. Generally, after that exercise they already have a good feeling if something is fishy or not. They package the report with references, sources, and their analysis, and send it to the internal investigators.
Now the interesting bit: once the file arrives in the hands of the investigators, the action starts. Fraud inspectors are much more specialized. They are generally technical inspectors that got their private investigator (PI) license. They will interview people, perform more in-depth analyses, connect more elements, and leverage their network. They see it all. (You cannot imagine the ludicrous cases they sometimes crack.) Once they gathered sufficient evidence proving a fraudulent claim, they’ll write a report and send it to the courts. Sometimes the case is dismissed, either because of a lack of evidence, or because it wasn’t fraudulent.
Discussing with experts and investigators, we identified roughly the following fraud categories in non-life insurance:
- Hard Fraud
- Staged accidents, for example, car crashes or fires
- Planned theft
- Soft Fraud
- Missing drivers (or inaccurate principal driver details) to pay lower premiums
- Inaccurate or missing contract details (address, value of goods), also to pay lower premiums
- Over-reporting (opportunity fraud) such as inflating value of lost/stolen goods, or reporting unrelated damages
As you can imagine, the amounts can vary quite a bit from one case to another: between an additional bumper (EUR 300), a burned kitchen (EUR 15k), or a sports car (EUR 100k), the difference can be steep.
For life insurance, you can have other things such as money laundering.
Understanding Bottlenecks
While shadowing our friends in claims management, we ended up:
- measuring how long the different steps of the process took,
- listing the tools that were used to perform the various tasks,
- understand the artifacts collected or created at each step of the process.
Unsurprisingly, the claims management systems were effective for handling individual claims. For collecting ancillary data about the claim, the story is quite different. Claim experts were spending an insane 20 to 30 minutes to collect all available information around a claim when creating the report for fraud inspectors. Most of the data was in the system, but the interface was so cumbersome that it took forever to gather and organize.
We had the data. It was already consolidated in our OCV.
Could we leverage it to:
- Improve the data collection and report creation times?
- Make the report easy to share?
- (Bonus) Define additional red flags based different metrics?
Prototype
Our team looked at the different ways to visualize data.
The most common way is through tables. Tables are good to browse and filter large amount of structured data. Tables are not good, however, for looking at the relationship between your table elements. Our automated flags were already handling things that tables enabled. We needed something else.
How can we improve relationship discovery?
Graphs!
Think of a (property) graph as a set of nodes (entities, items) and vertices (relationships). If you are familiar with relational databases made of tables: one table is one node type, while your foreign keys are your relationships. The columns in your table are the properties of your nodes or relationships.
You’ve probably noticed that I qualified the graph with the word “property”. There are different ways to represent a graph. One is a property graph. Another common graph representation is RDF.
This is what a typical car insurance graph might look like for a customer. Each node or vertex can have multiple properties (not shown). A dotted vertex indicates an inferred relationship.
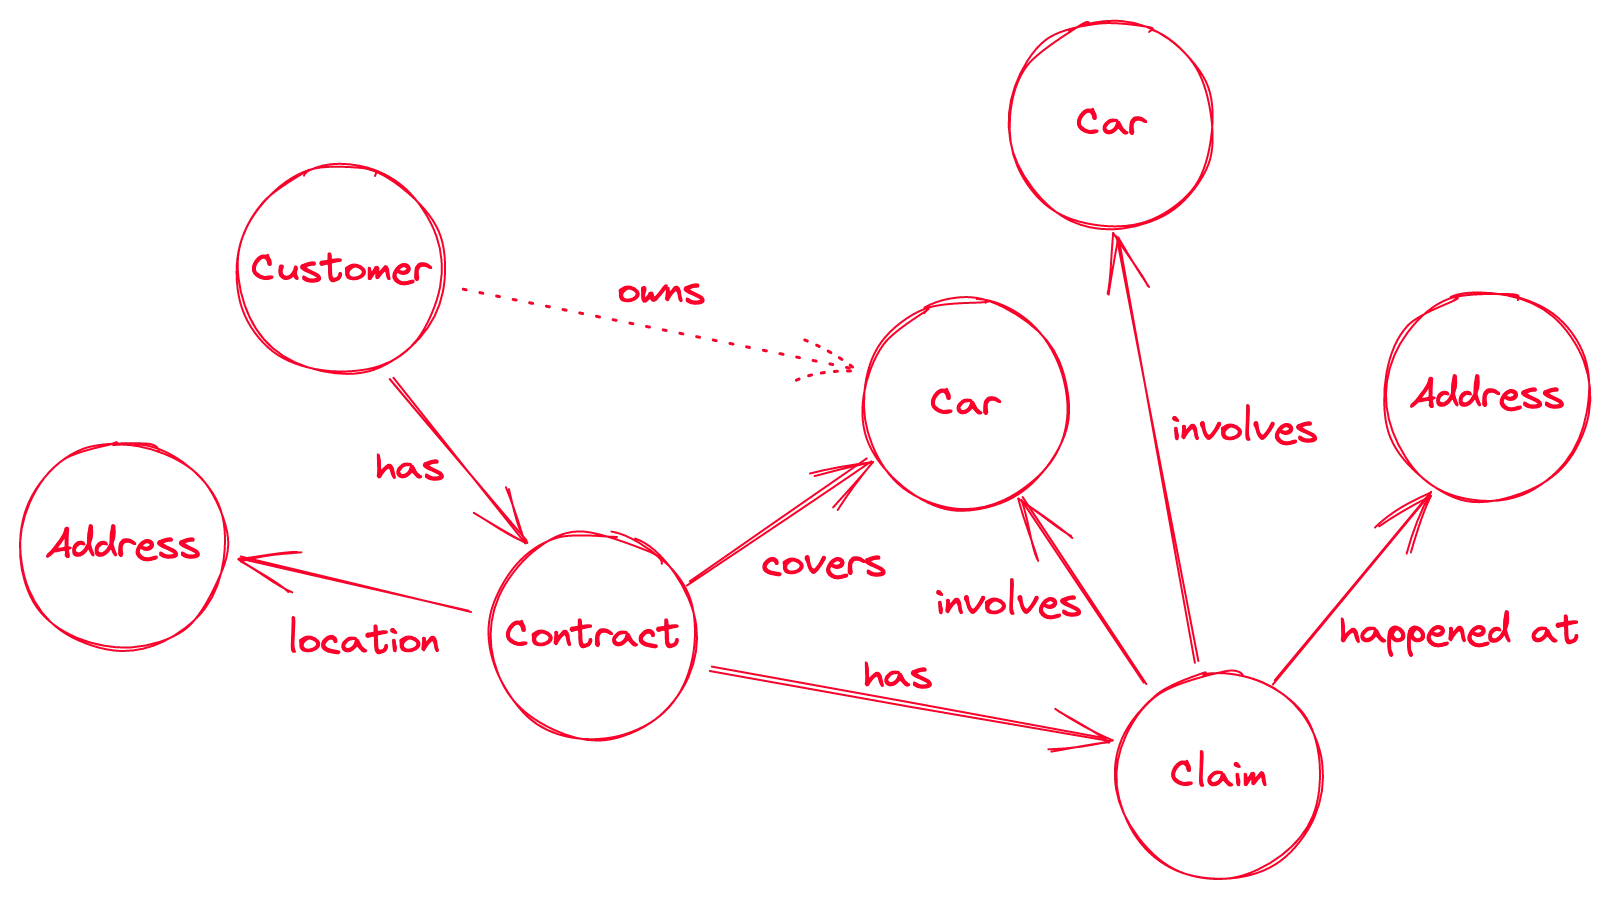
There are, of course, many ways to represent such a graph. The address for example could be additionally split into the street or postcode. The car is actually the vehicle’s chassis number, and we could then add the license plate as well as an independent entity. The primary driver of the contract should be added, and can be different from the customer (policyholder), and from the driver at the moment of the claim.
Here’s an alternative and more detailed example of a claim:
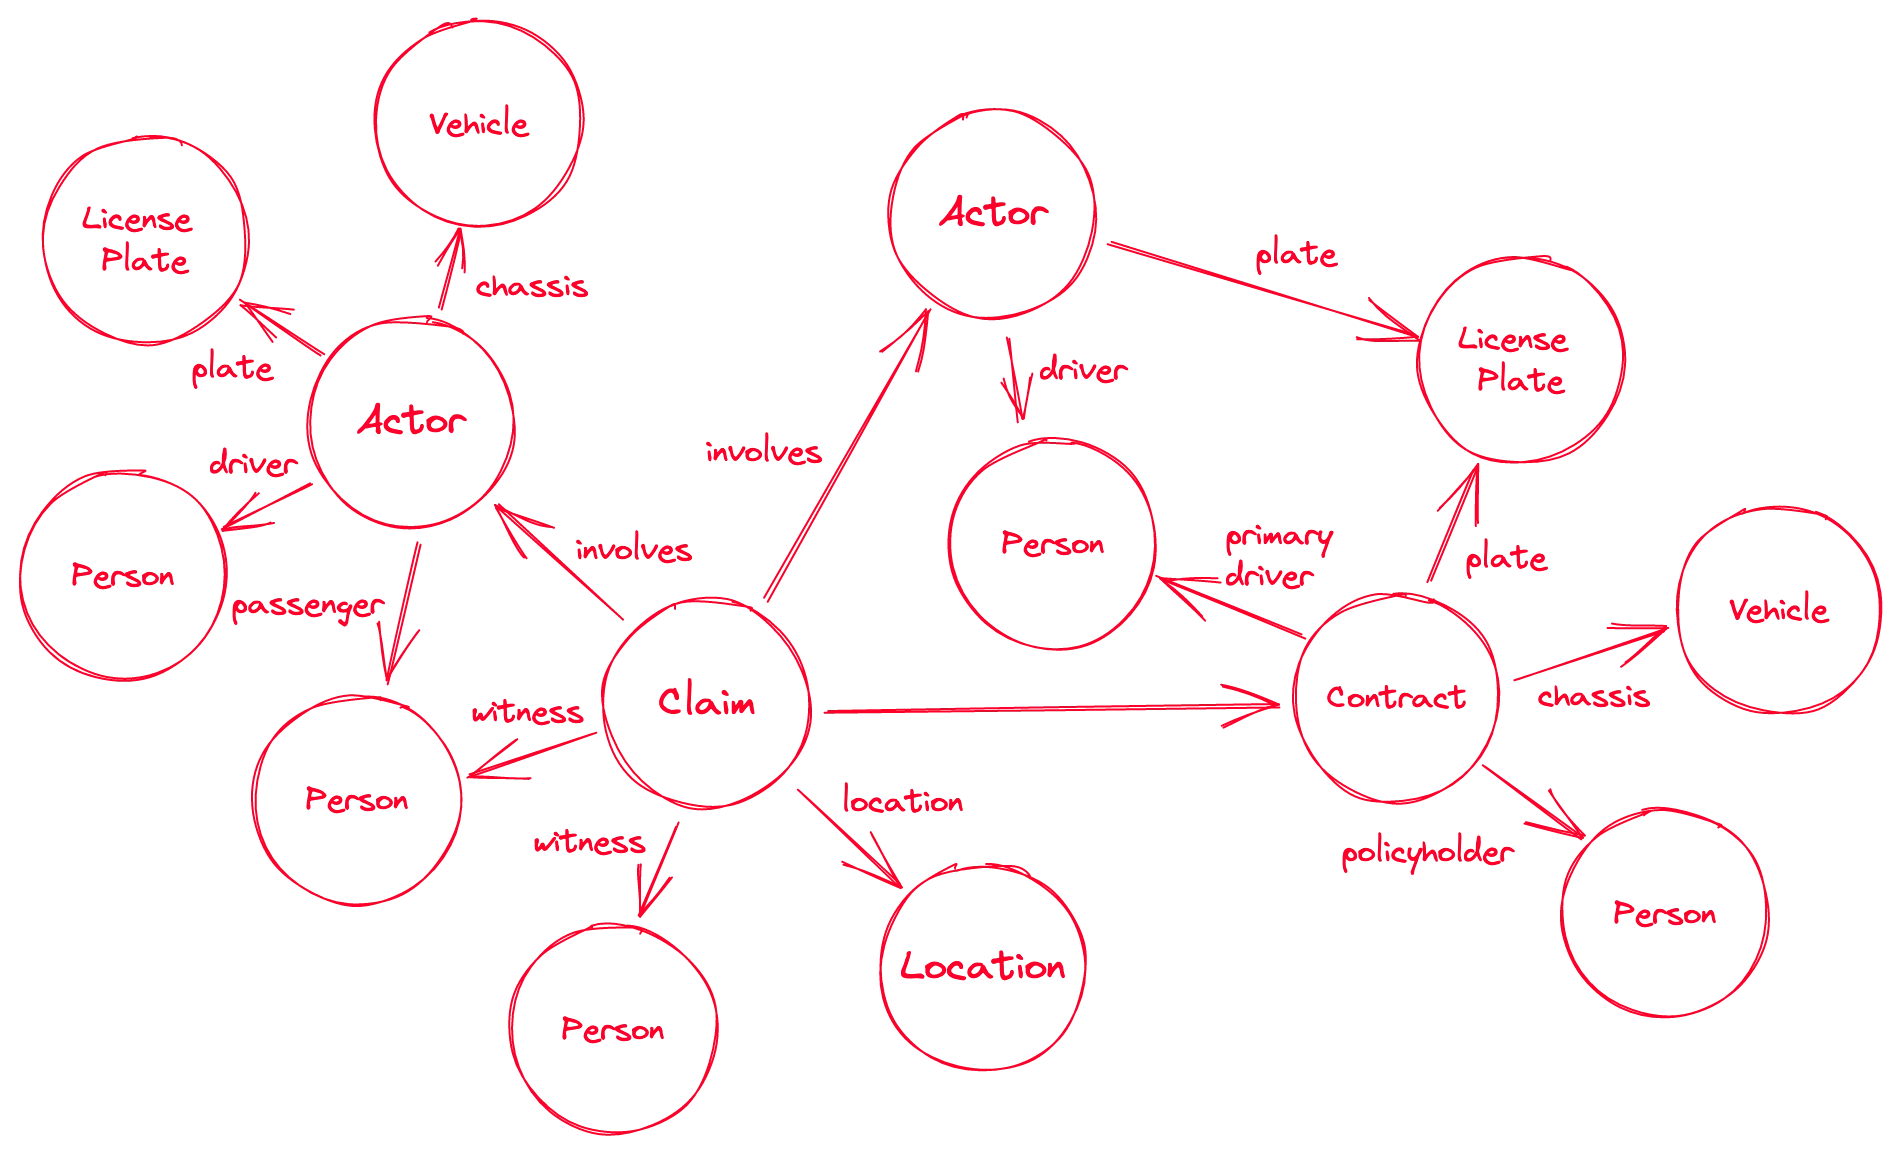
We showed these sketches to claim experts and they were received positively. They gave us a few pointers as to which additional information they’d like to see.
Let’s make it happen!
Selecting the Tools
We did a small online search to see if there were any software on the market that could tick our boxes and would not require any software development.
We found many property-graph databases and some visualization libraries. Most graph databases also offered some form of interactive graph exploration. We spent a week testing the different options, and roughly evaluating them:
- usability of the user interface
- installation/setup
- ingestion of data
- quality of the documentation
- query language
- performance
- integration with other software / API
We settled on Neo4j, and because, at the time, the Panama Papers were all the rage. We also found a powerful (but paid) frontend: Linkurious.
We asked for some computing resources on the internal network, and while they were being provisioned, we started writing scripts locally.
Ingestion and Configuration
We had our One Client View (OCV), and we wanted to turn those tables into a graph.
With our target solution, that meant moving from multiple tables (contracts, claims, etc.) to only two: one for the nodes and their types, and one for relationships (and optionally one for properties). We wrote some scripts and generated two massive tables (smaller samples for local testing), then ingested these into the solution.
After some local testing, we ran these on the newly allocated servers.
Once the database was up, we could start running some queries. First on the provided user interface, then on the dedicated frontend solution.
Testing
Once everything was running, we reached out again to claim experts and investigators.
After a quick introduction to the system, we asked them to look at old and new cases using the new interface, and gather the relevant information to pass to investigators.
We measured the time it took them to gather the evidence with the new solution, and it was an average of 10 minutes. Up to 66% time saved!
Both claim experts and investigators had positive feedback:
- the relevant information was easy to browse, links easy to find
- full-text search was actually working (we had indexed everything with ElasticSearch)
- interface was usable and the ability to customize was useful for visualization e.g., using colors and shapes for different node types
But they also noted some limitations:
- full-text search could be overwhelming
- if they wanted additional details, they needed to go back to the legacy system
- there was no easy way to share the collected information directly from the app
- not easy to use on a tablet (which investigators use when going on site)
Would they miss the new solution? They all said yes.
Limitations and Next Steps
Looking at the feedback, we went back to the whiteboard and asked ourselves what would be required to get from prototype to an integrated solution.
We identified some elements that needed to be addressed:
- It should be easy to navigate from the graph exploration space to legacy systems and data.
- The available data should be fine-tuned to the user needs (search indexing, nodes and relationships).
- A sharing mechanism should be developed.
- The process and apps should integrate with company IT (IAM and SSO).
- We did not use operational data but the company data lake. An update schedule would have to be defined.
We wrote the report and handed it to the claims department with recommendations.
At the same time, we collected additional cases from our fraud investigators and defined additional red flags, triggered by specific graph patterns. Any time the system would detect a new observation of the defined patterns, the case would be flagged and send to the claims experts’ backlog.
Finally, the findings and the process was presented group-wide, across operating companies.
Additional talks about graph analytics were held with different departments.
The project resulted in multiple other initiatives around graph-based, group-wide, insurance metadata management.